
Suzuki Secret Shopper
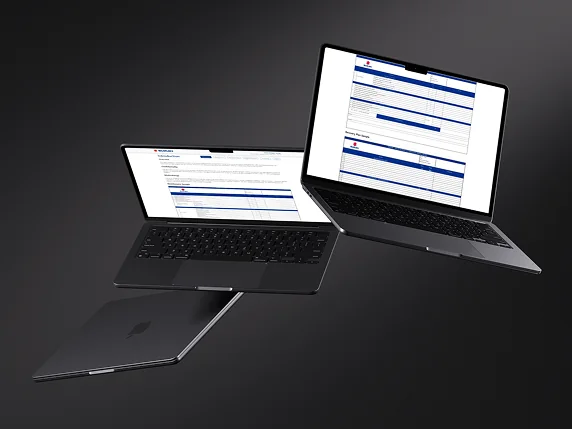
Structured assessments and reporting interfaces
An assessment report needs to help someone understand both the score and the questions behind it. The Suzuki Secret Shopper gallery puts those two levels side by side: a chart offers a quick comparison, while the introduction includes detailed questionnaire and recovery-plan samples.
What interests us here is the change in reading pace. A reviewer can scan the overall picture, then spend time with the individual assessment sections. The consistent blue section bars, restrained page layout and repeated navigation give these very different views a shared visual language.
What you can inspect
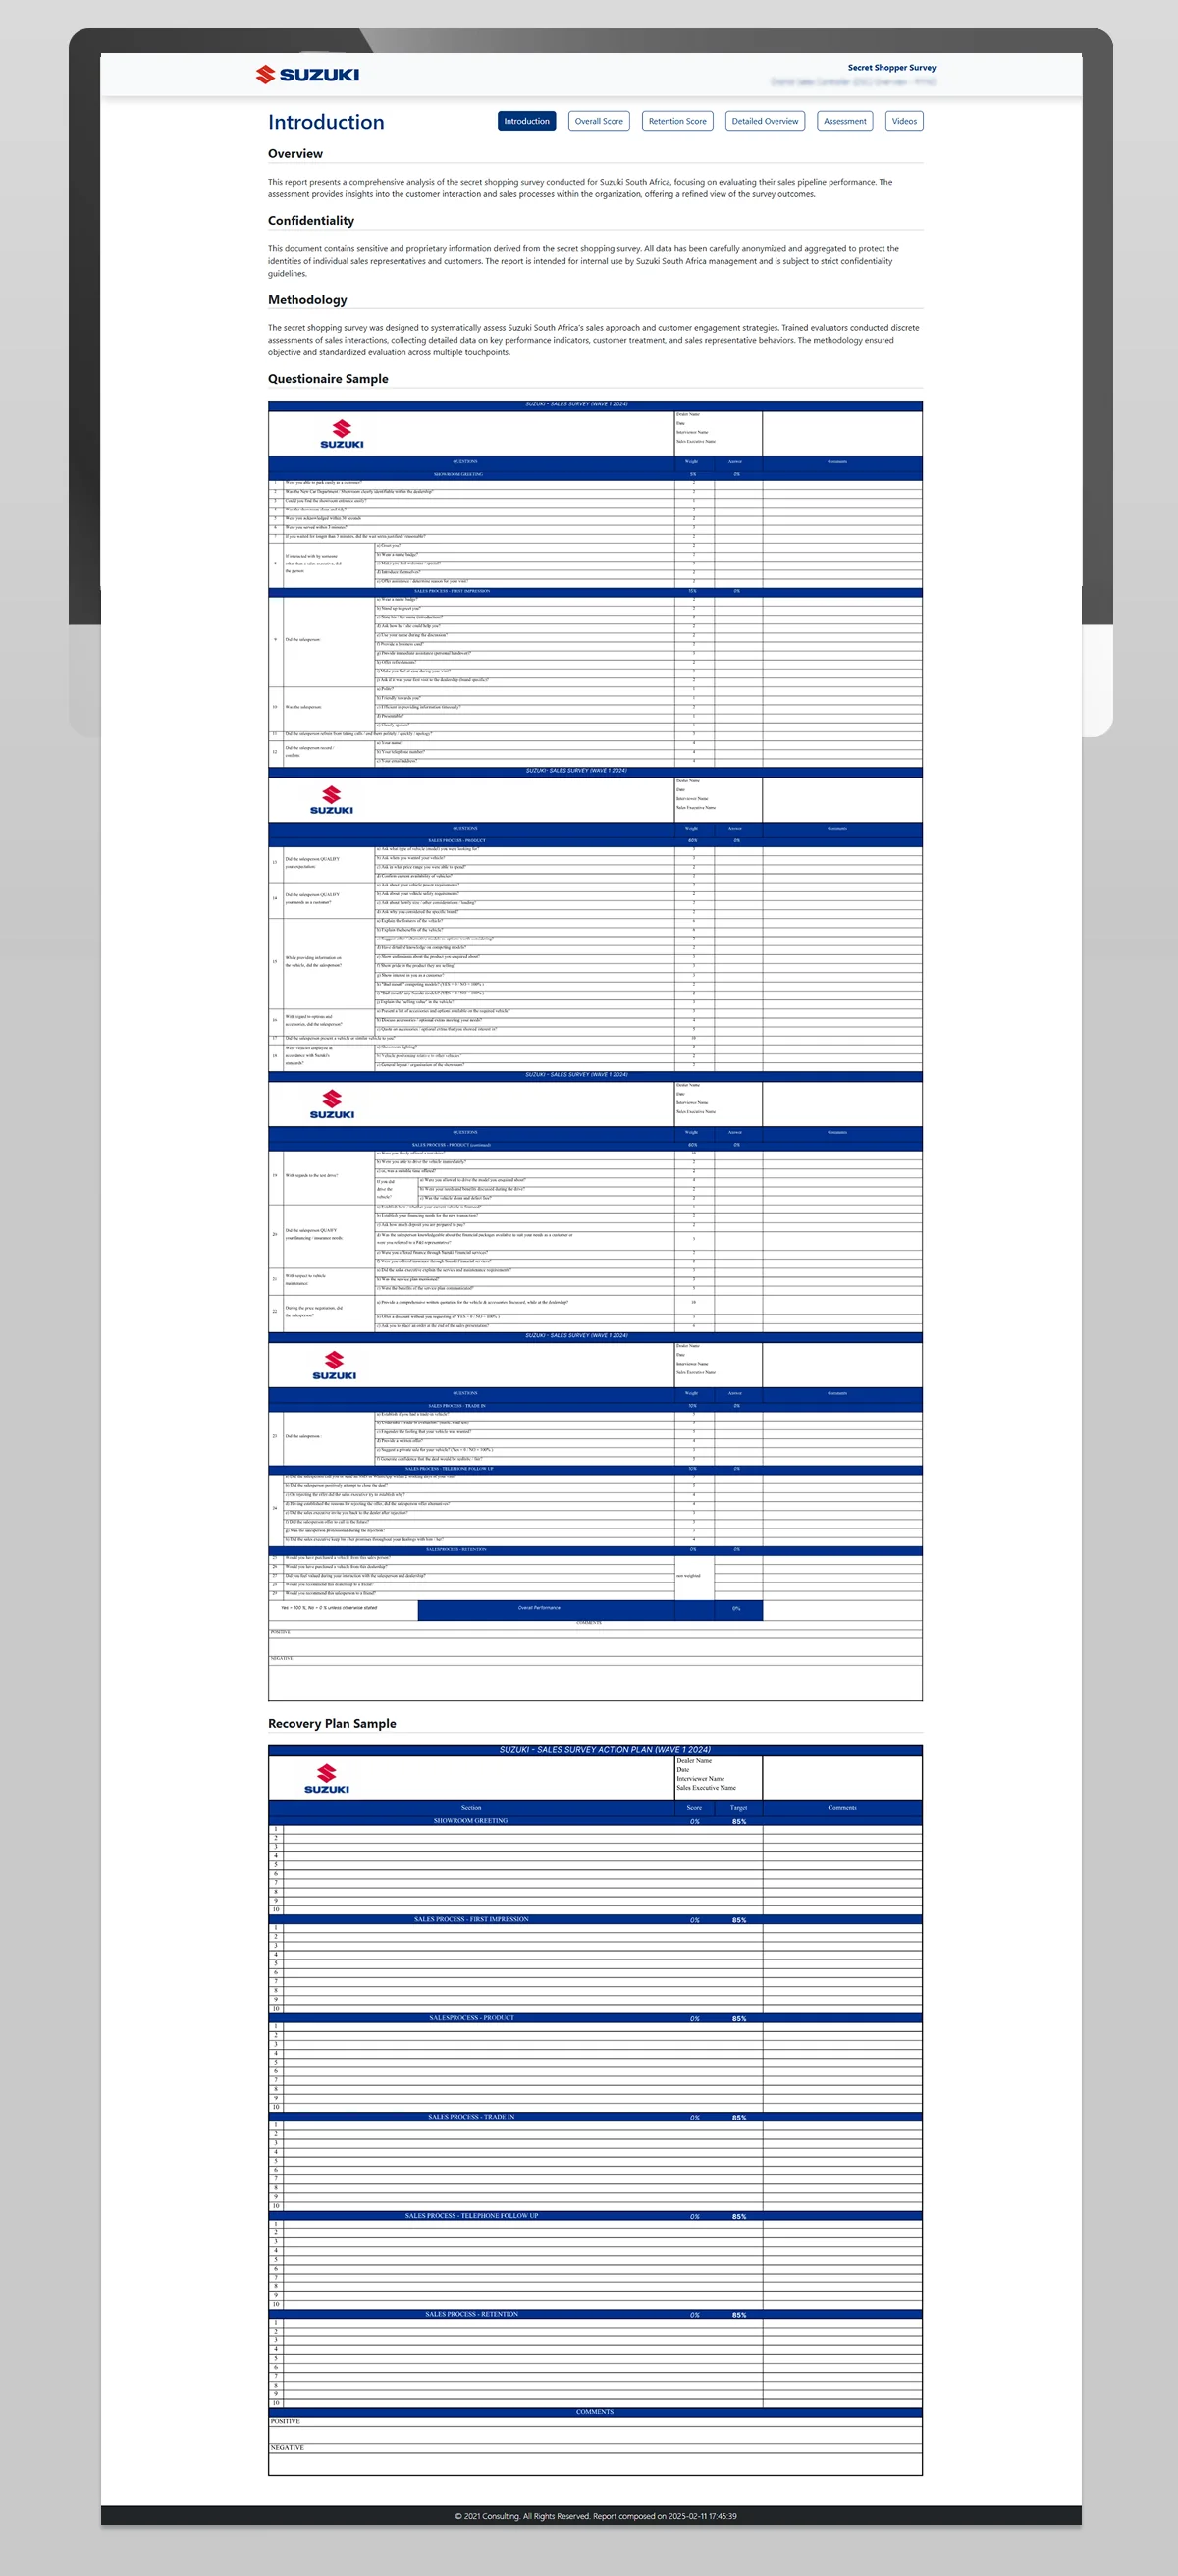
- The introduction places the overview, confidentiality statement and methodology before the questionnaire samples, giving readers context before the dense tables.
- Blue bands divide the questionnaire into sections, with questions, weights, answers and comments arranged in columns. Those divisions help a reader keep their place through a long assessment.
- The recovery-plan sample repeats the section structure and presents score, target and comment columns. You can compare how the assessment is organised with how follow-up information is presented.
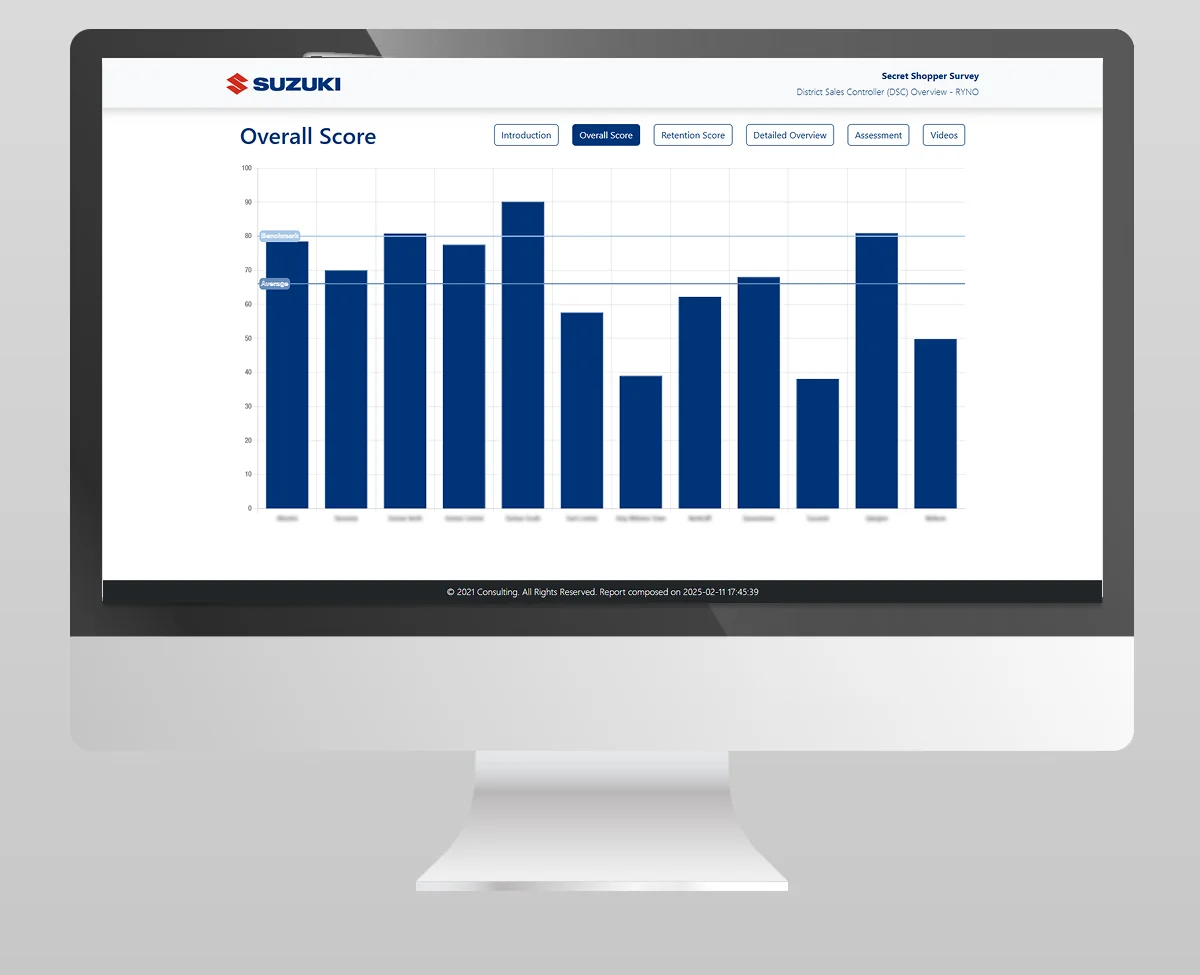
- The Overall Score screen uses blue bars with labelled benchmark and average lines. These provide reference points for reading the bars; the figures shown are part of the archived presentation, not evidence of a project outcome.
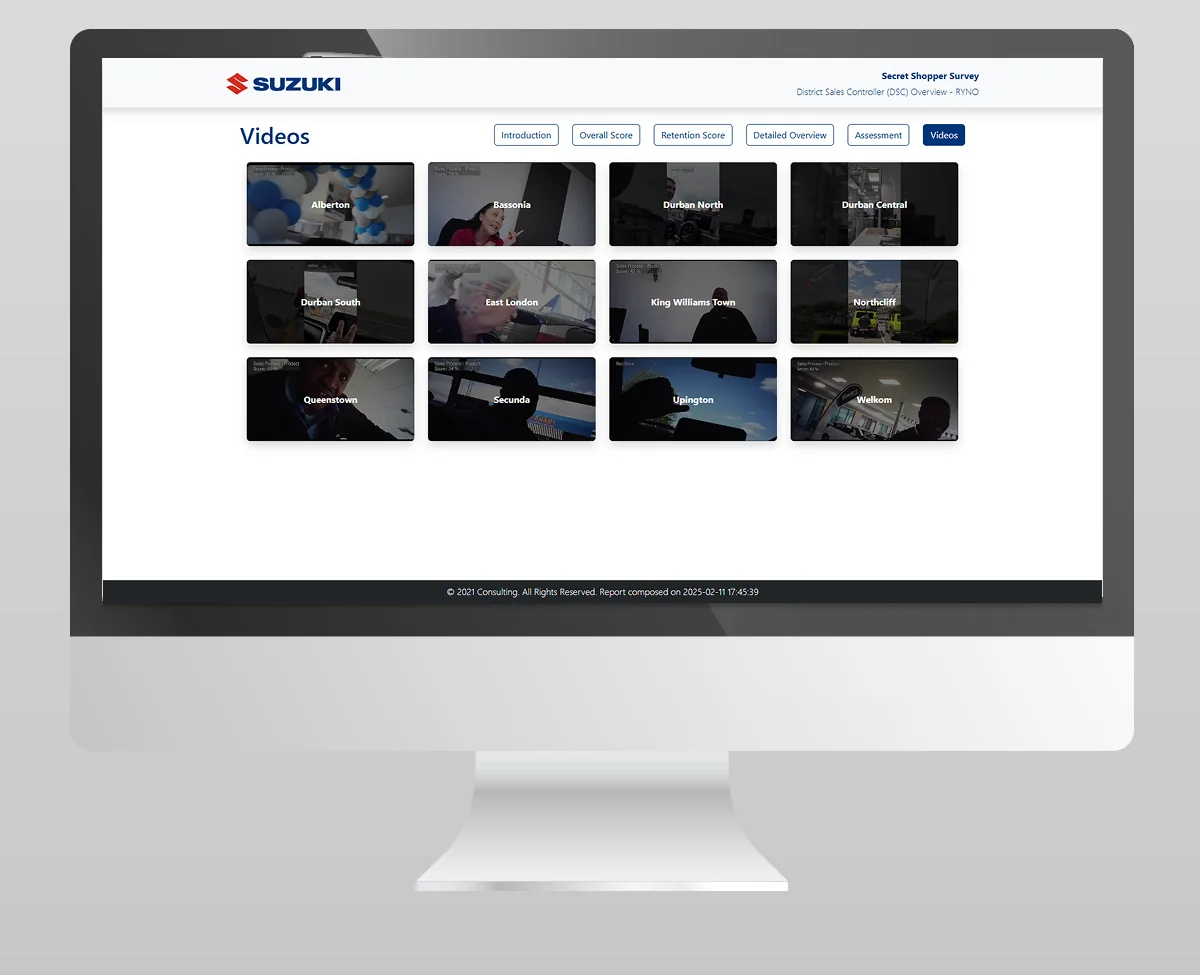
- Navigation labels include Introduction, Overall Score, Retention Score, Detailed Overview, Assessment and Videos. The selected view is filled in blue, while the other tabs remain outlined.
Open the original gallery below at full size to inspect the table spacing and chart labels. These images show the presented interface; they do not establish the production stack, live integrations, authorship of every element or measured business results.
What this means for a similar project
We would start with one real questionnaire and a sample of the report your team needs to read. Alongside the questions, bring the scoring rules, any questionnaire versions in use and an example of what should happen when an assessment identifies a problem. That gives us something concrete to discuss: what belongs in the overview, what needs a detailed table and who should be able to see each view.
For example, a low score in a greeting section might need a comment explaining what was observed before a manager can choose a follow-up action. In your own brief, decide whether that explanation belongs beside the score or in the detailed assessment, and how someone reviewing the recovery plan will find it. The visible samples make that relationship worth discussing before drawing more dashboard screens.
Explore assessment and mystery-shopping platforms or review website and service pricing. To discuss similar work, include this project link and the task you want your own customers or team to complete.
Suzuki Secret Shopper
Project gallery.
Open a visual to explore it at full size. Use the arrow keys to move through the gallery and Escape to close.
Keep the right things connected.
Assessment and Mystery Shopping Systems
Scope custom questionnaires, evaluator workflows, multi-location assessments, scoring, controlled invitations and role-based reporting.
Service Pricing & Project Estimators
Choose a service estimator, explore scope and separate known costs from items that need a custom quote.
Dealership Websites & Automotive Systems
Connect vehicle discovery, campaign landing pages and dealer enquiries with practical website, marketing and integration work for automotive businesses.
Start a conversation
Tell us what you are working towards. We’ll help you find a practical next step.